Health & Fitness
Northern Virginia Housing Update: 2008 to 2012
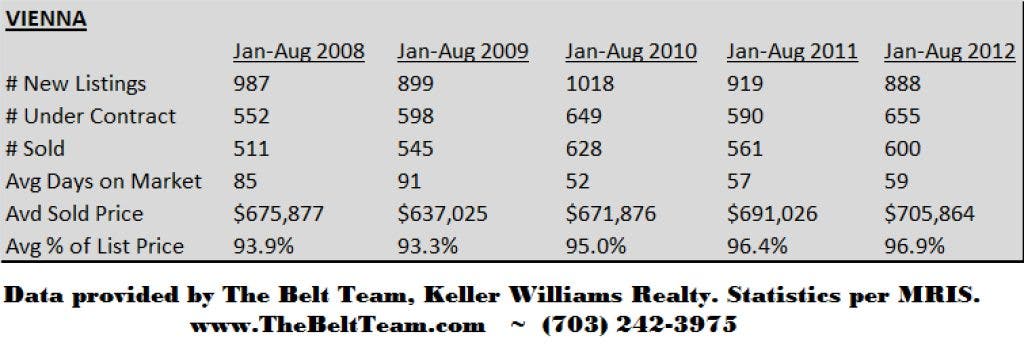
Wondering how home sales and prices compare year over year from 2008 to 2012? Wonder no more! Here are your updated statistics from January through August
Labor Day has come and gone. The kids have gone back to school. And sales over the past week slowed as they always do over this holiday weekend. That being said, we're still seeing a Seller's Market in many areas. As an example, last week's real estate stats for Vienna and Oakton are below:
Last week in Vienna Real Estate (22180, 22181, 22182):
Find out what's happening in Viennawith free, real-time updates from Patch.
- Number of Contracts: 10
- Average Days on Market for Active Listings: 110 days
- Average Days on Market for Listings That Went Under Contract: 35 days
- Inventory: 180 homes on the market
- Number of Months Supply of Homes (Based on past 90 day contract rate): 2.5 months
- Number of Months Supply of Homes (Based on past 30 day contract rate): 2.6 months
Last week in Oakton Real Estate (22124):
Find out what's happening in Viennawith free, real-time updates from Patch.
Search Homes For Sale in Oakton
- Number of Contracts: 3
- Average Days on Market for Active Listings: 97 days
- Average Days on Market for Listings That Went Under Contract: 43
- Inventory: 73 homes on the market
- Number of Months Supply of Homes (Based on past 90 day contract rate): 2.3 months
- Number of Months Supply of Homes (Based on past 30 day contract rate): 2.8 months
We still have one more quarter to go before we can look back at 2012 and evaluate the annual Northern Virginia real estate market, but now is a good time to do a year-over-year comparison for listings & sales from January through August.
- In most (but not all) areas, we have seen prices rising year-over-year from 2009-2012.
- Average days on market have fluctuated, but are down overall from 2008 to 2012.
- Most areas have seen a rise in the average sold price as a percentage of original list price.
- Most areas have seen an overall decrease in the number of new listings coming on the market, while at the same time an increase in the number of sales.
Detailed statistics from 2008 to 2012 for a sampling of our Northern Virginia real estate markets (Fairfax, Great Falls, McLean, Oakton, Reston & Vienna) are listed on our Northern VA real estate blog.
For more information, contact The Belt Team at 703-242-3975 for a more in-depth discussion and analysis.